How to enter and charting vitals in table/graph view on the Anesthetic sheet?
Print
Modified on: Mon, 16 Sep, 2019 at 7:34 AM
As you may know from THIS article there are two options available for making your Anesthetic sheet: the ability to display a table view of the anesthetic sheet, whereby numerical values are displayed or the use of symbol/ graph view of the anesthetic sheet.
The touch screen entry of values on the anesthetic sheet is very helpful. It provides you with an opportunity to create a specific pattern when entering monitoring values - i.e. HR > RR > EtCo2 > Sys BP, etc., This allows staff to enter values in the appropriate spot on the time table vs. using a value graph.
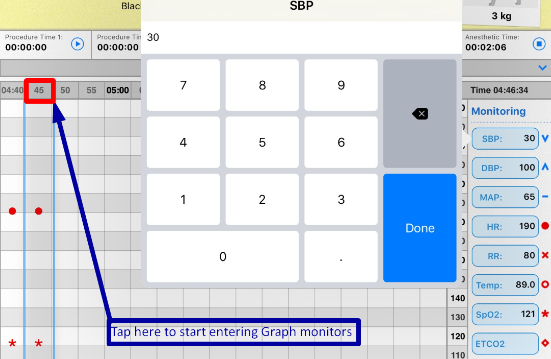
To start charting the monitoring parameters for the current time (illustrated in the blue frame), press and hold the box with the appropriate monitoring parameter name (as in the example below: SBP) to display the monitoring option popup. Then, go ahead and fill the vitals. Once the values are entered, you will see that the vitals are presented as a symbol (below they are illustrated as dots and stars):
Now you can monitor the parameter values and make any necessary changes (for example, go back in time on the anesthetic sheet to enter vitals as described HERE).
Please note that depending on the type of view, you can enter the same vitals but they will look different:
Graph view:
vitals presented as symbols on the flowsheet
 | Table view:
exact values presented in the corresponding cells
 |
To switch between graph and table view you should click on the small arrow next to the Monitoring tab:
Graph view to Table | Table view to Graph
 |
NOTE: By clicking a cell, you can enter a note or the parameter related to that row of cells.
We hope you found this information useful!
Did you find it helpful?
Yes
No
Send feedback Sorry we couldn't be helpful. Help us improve this article with your feedback.